Don't block your threads with IO bound operations
Many of us use the async/await feature in C# projects, as we know the benefits of asynchronous programming related to IO bound operations. But did you ever look under the hood to check what's going on in your app's threads? In this post we will diagnose a sample app, monitoring it's threads behavior when using sequential, parallel and asynchronous code.
The purpose of our sample console app is to download some pages from the internet. In the real world example, we would probably parse them and
process the information somehow. To keep our example simple, instead of downloading 10 various pages, we just download the page https://borza.dev/blog
10 times. We will diagnostic the threads' behavior with Concurrency Visualizer -
an optional extension for Visual Studio.
Sequential approach
At first, we use the usual sequential approach as below:
for (var i = 0; i < 10; i++)
{
    using (var webClient = new WebClient())
    {
        var response = webClient.DownloadString("https://borza.dev/blog");
    }
}

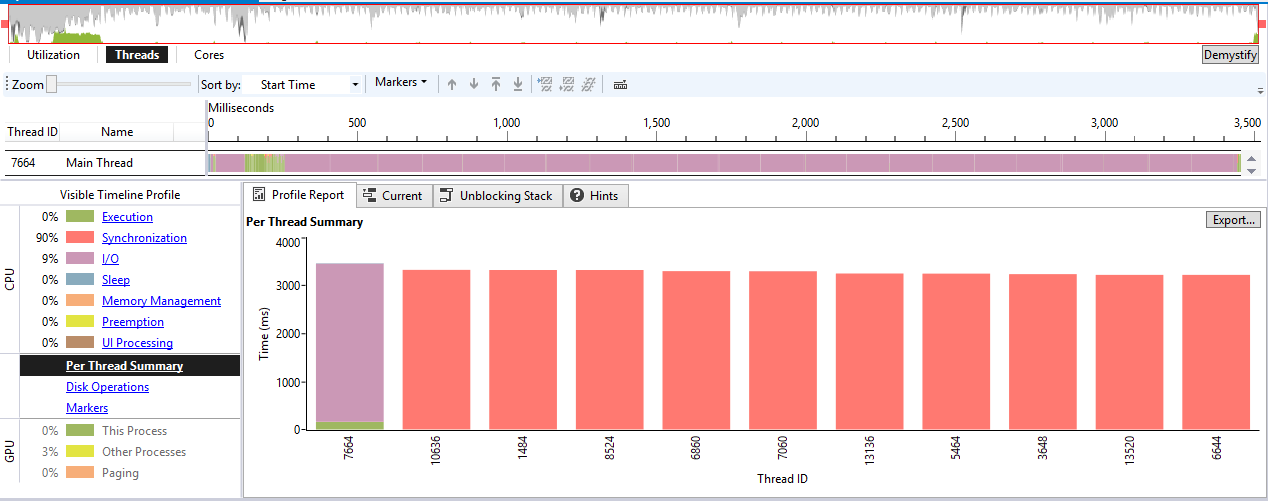
When we take a look on threads view, we can see that the CPU's peaks correlate with execution parts (green color) on the main thread. It's obvious that all the operations run on main thread, where the execution blocks alternate with IO bound blocks (purple color). We can see that most of the time the main thread is blocked, synchronously waiting for completion of the IO operations (the HTTP requests).

As you can see, beside the main thread there are more threads in the report. However, they are not used by the app. They are either the threadpool threads or they are bound to debugger and concurrency visualizer sessions.
Parallel approach
The application obviously works, but let's say that our manager is unhappy with it's performance. He want to make it quicker. We examine the code and because
downloading a web page is an independent operation, we decide to make the calls in parallel.
Parallel.For(0, 10, i =>
{
    using (var webClient = new WebClient())
    {
        var response = webClient.DownloadString("https://borza.dev/blog");
    }
});
Let's take a look on information from Concurrency Visualizer. Now the program execution took 1757 ms, which is quite an improvement. We can also see that the engine utilization peaks are higher than in the sequential version, especially after application's start, when the requests for downloading the page are being sent in parallel. As there is also some thread switching overhead (obviously on 4 cores machine just 4 threads can run in the same moment) and some responses are processed in parallel, the bigger cpu utilization makes sense.I had not used
new Thread(() => ..).Start()as it is considered as bad practice nowadays. It forces new thread creation, which takes cca 200 000 cycles on processor, and another 100 000 when disposing the thread. Except of some special cases, it's wrong when you create new threads in your application this way. By default you should use methods from Task Parallel Library, which operates on threadpool and provides far more efficient use of system resources.

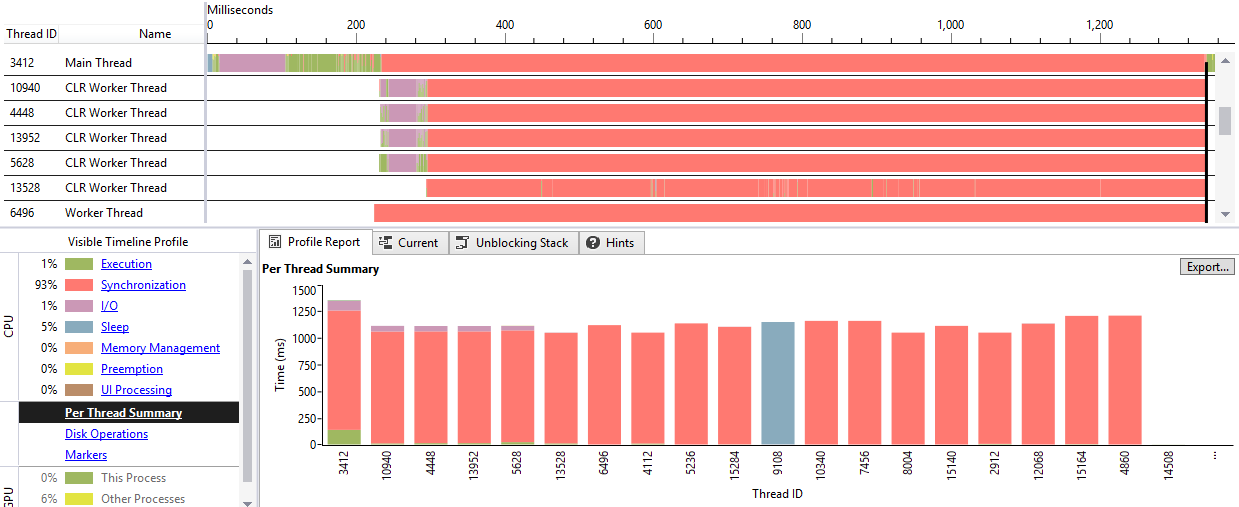
The threads section from the report reveals even more details about parallel execution. As you can see, beside the main thread the majority of the
execution was delegated to 4 others Common Language Runtime Worker threads. For that reason, the program was executed quicker. However, as in the
sequential execution case, most of the time the threads does not execute any CPU bound work - they are blocked by waiting on completion of IO bound
webClient.DownloadString operations.

Giving a try to asynchronous code
So we fixed the issue with the speed of the application and it worked well. However, after some time a new requirement for downloading thousands of pages
emerged. Testing with this number of pages shows that our simple console app consumes much more
resources (threads and time) than it should. The cause is clear - with increasing number of parallel HTTP requests grows also the
number of threads in the app. As they are synchronously waiting for completion of the IO operation, they cannot be reused for other work and
new threads has to be created. Intense thread switching doesn't help the performance either.
What is the solution for this problem? Asking the project manager for bigger operation memory and better CPU?
No, there is much better improvement we can do to make our app more scalable - downloading the pages in asynchronous way. We can rewrite the code
in following way.
using (var webClient = new HttpClient())
{
    var tasks = new Task[10];
    for (var i = 0; i < 10; i++)
    {
        tasks[i] = webClient.GetStringAsync("https://borza.dev/blog");
    }
    Task.WhenAll(tasks).Wait();
}
I used
Wait()method instead ofawait, as this code is running inMainmethod of console application, which is synchronous. Thus I am synchronously blocking the main thread, waiting for all async tasks to complete. However, it's still better than blocking all threads with IO operations.
After running analysis in this code snippet, we can see some improvements comparing to previous parallel execution. We got slightly better execution time -
1353 ms. Also CPU utilization graph shows that it's usage is more balanced than with Parallel.For version.

What interests us the most is the behavior of threads. We can see, that the percentage of IO operations was reduced to 1% (from previous 25%). In the reality the improvement is even better, as the report shows also threads that our app don't operate with. As in the previous case, the work was delegated mainly to main thread and other 4 CLR Worker threads.

The most important difference is that the threads are no longer waiting for completion of IO bound operations, but they are released back to the thread pool. This way they can be reused by other CPU bound operations.
Comments
Latest Posts
-
Designing a scalable and secure trading platform on top of Kubernetes
14 July 2020, C#, Architecture, Signals Network, K8s -
Leveraging Hexagonal architecture in Signals Framework’s design
24 June 2019, C#, Architecture, Signals NetworkI created this technical article for Signals company in cooperation...
-
Breaking down the Signals Platform
11 April 2019, C#, Architecture, Signals NetworkI created this technical article for Signals company in cooperation...
-
Don't block your threads with IO bound operations
4 February 2017, C#, AsyncMany of us use the async/await feature in C# projects,...
